Frequently Asked Questions
How do I get data into EDD?
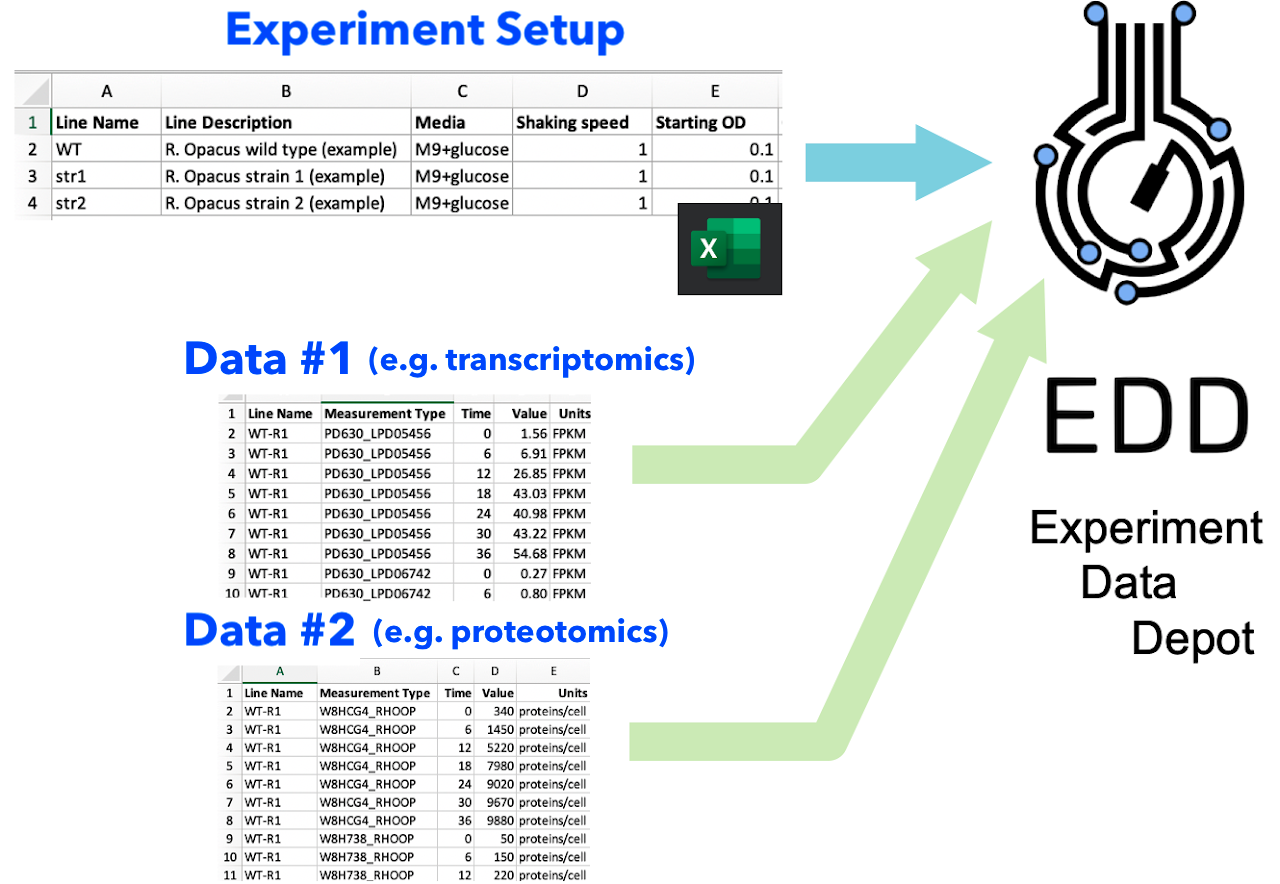
The Experiment Data Depot (EDD) imports data in two steps. (Fig. 1)
-
Experiment Setup input: this file describes your experiment design so EDD knows how to store all your data, and how it is related to your strains and samples.
-
Data input: different types of data can be added in several successive steps. These data input steps are independent of each other, facilitating the combination of different types of data (e.g. multiomics data sets).
You can find tutorials and protocols for study creation and data import.

What is an Experiment Setup file?
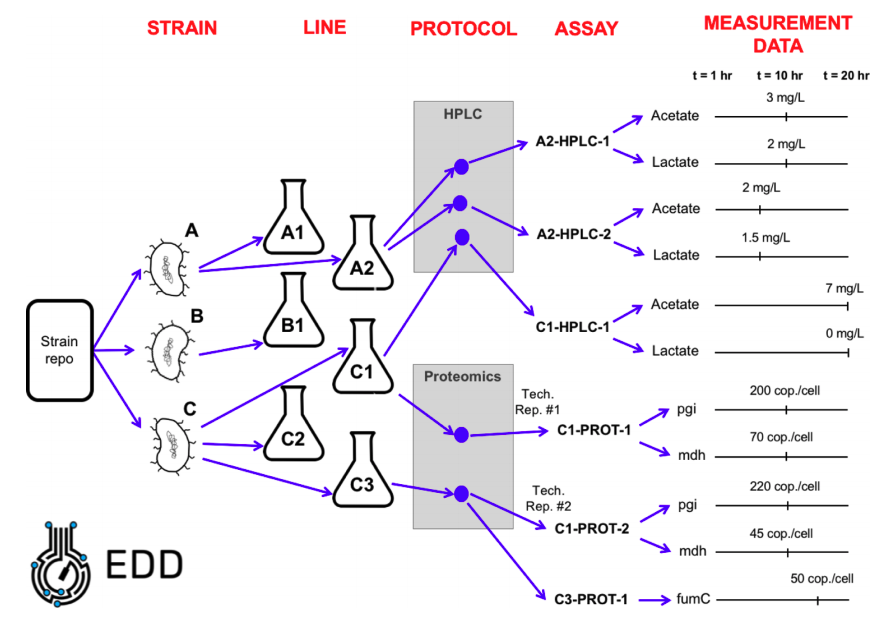
An Experiment Setup file is a table that describes your experiment (Fig. 2): which strains you are using (part ID from ICE), how they are being cultured (lines and metadata), which samples are being taken (assays) and how they are processed (protocol). Look at Fig. 3 to see how EDD organizes your experimental data.
The Experiment Setup file has a header row defining the layout of values in all the following rows. There is only one required column in the header, for “name” or “line name”. The header can also have columns for:
- “description” or “line description”, to fill in a Line’s description field
- “part id” or “strain”, to define identifiers or links to strains used
- “replicate” or “replicate count” to set the number of (biological) replicates used for the Line definition
- any other column can be interpreted as metadata
All other rows in the Experiment Setup file are used to map the columns into records to save into EDD. The upload process will attempt to match metadata columns to known metadata types in EDD, and add those metadata to the Line for that row in the file.
If a metadata type cannot be matched to one in EDD automatically, a form will be shown giving you the option to select a known metadata type to use (e.g. if your column is “Temp.”, EDD may not be able to automatically match to “Temperature”, but you can select that from the search box), or choose an option to create a new metadata type in EDD if your account has permission to create new metadata types, or choose an option to ignore the column.
If a piece of metadata is Assay metadata, EDD will ask for the Protocol to use for that Assay. Every Assay is defined by a Line and a Protocol, so adding metadata to an Assay requires knowing the Protocol to use. The Experiment Setup process will then create an Assay and assign that metadata to it.
Values in the “part id” or “strain” column will attempt to look up a matching entry in ICE. If a matching entry cannot be found, EDD will show a search box to map that value to a strain registry entry.


What is a line?
A “Line” in EDD is a distinct set of experimental conditions, (e.g. a single culture). A Line generally corresponds to the contents of a shake flask or well plate, though it could also be, e.g., a tube containing an arabidopsis seed or an ionic liquid for a given pretreament. A line is not a sample: several samples can be obtained from a single line at different times (see Fig. 3).
A typical experiment (Fig. 3) would take strains from a repository, culture them in different flasks (lines), apply a protocol at a given time (an assay), and obtain different measurement data. Protocols are kept under protocols.io to enable reproducibility and better communication. You can find the LBNL repository here.

How do I choose good line names?
A good way to name your lines involves the strain name, culture conditions and whichever other condition is being changed in the experiment. For example, WT-LB-70C would indicate is a wild type, grown on LB at 70º C (imagine you are trying different growth temperatures). Cineole-EZ-50C indicates a cineole producing strain, grown on EZ at 50º C … etc.
Why should I use the Experiment Data Depot?
The Experiment Data Depot (EDD) is a standardized repository of experimental data. This is useful for the following reasons:
-
EDD provides a single point of storage for your experimental data, to be easily referenced. Instead of providing a collection of spreadsheets organized in an adhoc manner in the supplementary material of your paper, you can give a single URL where your readers can find all the data in a format that is always the same. This will make your papers more likely to be cited. In the same way that storing your strain information in the Inventory of Composable Elements (ICE) will make it easier to access and more likely to be cited.
-
Easily collate different types of multiomics data. Comparing the results of phenotyping a cell using transcriptomics, proteomics and metabolomics can be complicated. EDD facilitates this task with the use of a standard vocabulary for genes, proteins and metabolites, solving the problem of leveraging multiomics data.
-
EDD facilitates data analysis. By using a standard data format through EDD, you can leverage previously created Jupyter notebooks to easily do your calibrations and statistics (e.g. calcualte error bars).
-
Enable Advanced Learn techniques. EDD helps you interact with data scientists to use Machine Learning and Artificial Intelligence techniques to effectively guide metabolic engineering. Just give them the link of your study and you will save them the wrangling of spreadsheets that consumes 50-80% of their time.
Why can’t I see the data in the link?
You may not have the correct permissions to view the Study. Ask the person who sent you the link to give you read permissions.
What is a slug?
A slug is a way to identify a Study in links in a more easily readable form.
Using a slug allows for links to look like the below, with slug pcap:
https://public-edd.jbei.org/s/pcap/overview/
Instead of using a link to the same study that looks like this:
https://public-edd.jbei.org/study/2843/overview/